As I've mentioned in previous posts, I've been finding a lot of cheap stocks in Hong Kong lately. One I've recently purchased is G & M Holdings (HK:6038).
G & M designs, builds and repairs podium facades, curtain walls, glass walls and other products in Hong Kong. At 16.2 cents per share, the market cap is 162m HKD.
G & M is an attractive opportunity because:
It trades at a low multiple of earnings. G & M earned $36.8m net income in FY21, putting the company on a trailing P/E of 4.4. From FY16-FY21, G & M earned cumulative net income of 225.75m, equivalent to 22.58 cents per share (roughly 140% of the current market cap).
It trades at a discount to its net current asset value. As of December 31, G & M trades at a roughly 33% discount to its net current asset value of $240m (calculated as current assets less total liabilities).
It has a history of paying dividends. Since listing in June 2017, G & M has paid dividends of 7.25 cents per share. G & M recently announced a final dividend for FY21 of 1.1 cents per share, payable on July 8, 2022, bringing the total to 8.35 cents per share since listing. In other words, G & M has paid more than 50% of its current market cap in dividends since FY17. The trailing dividend yield is 10.2%.
G & M has historically earned a reasonable return on capital. In FY21, G & M earned roughly 45m pretax on invested capital of 266m, ~16.9% ROCE. (Note I have not deducted any cash from working capital in calculating invested capital, for reasons I will discuss later.) ROCE averaged 15.72% over FY18-FY21.
G & M has $574m in outstanding contracts, equivalent to 1.4 years of revenue at current rates. G & M is currently bidding or waiting on the results of four podium facade project tenders with an estimated contract value of $357.8m.
Financial data
* N.B. I’ve assumed zero excess cash, but G & M has historically held very large cash balances
Dividend history from David Webb’s site
N.B. Final dividend for FY21 not included in table: https://www1.hkexnews.hk/listedco/listconews/sehk/2022/0328/2022032800190.pdf
Why is this opportunity available?
G & M is an extremely small company with a market cap of ~162m HKD (~25.5m AUD)
The public float is only 250m shares (40.5m HKD/~$7m AUD at current prices). The two controlling shareholders — Mr Lee Chi Hung (chairman, CEO and co-founder, age 56) and Mr Leung Ping Kwan (non-executive director) — own 75% of G & M’s shares through their holding company, Luxury Booming Ltd. Mr Lee controls 75% of the issued share capital of Luxury, and therefore has ultimate control of G & M; Mr Leung owns the remaining 25% of Luxury Booming.
Despite solid operating results, G & M shares have performed poorly since IPO. G & M currently trades 60% below its listing price of 41 cents. Even when dividends are included IPO buyers are still down ~43%.
The Hong Kong market has performed poorly in recent years. The Hang Seng is down about 23.5% over the last year and down about 10% over the last five years. Besides the political unrest in Hong Kong, there has been a widespread sell-off in HK and Chinese stocks following the Ukraine crisis. HK is also experiencing a deadly COVID wave, however it seems the peak has passed.
G & M’s business
A podium facade is the external surface of the podium or atrium part of a building, typically made up of glass, cladding, granite and other materials.
 |
| Podium facade by G & M, Taikoo Place Development |
A Curtain wall is the external surface of the building above the atrium portion, typically made of glass, aluminum or other materials.
 |
| Curtain wall by G & M, KCTL 522, Kwai On Road, Kwai Chung |
G & M is a subcontractor, and typically works with property developers, main contractors or public bodies. It specialises in podium facade projects; according to the prospectus, G & M was the second largest player in the HK podium facade industry as of 2015.
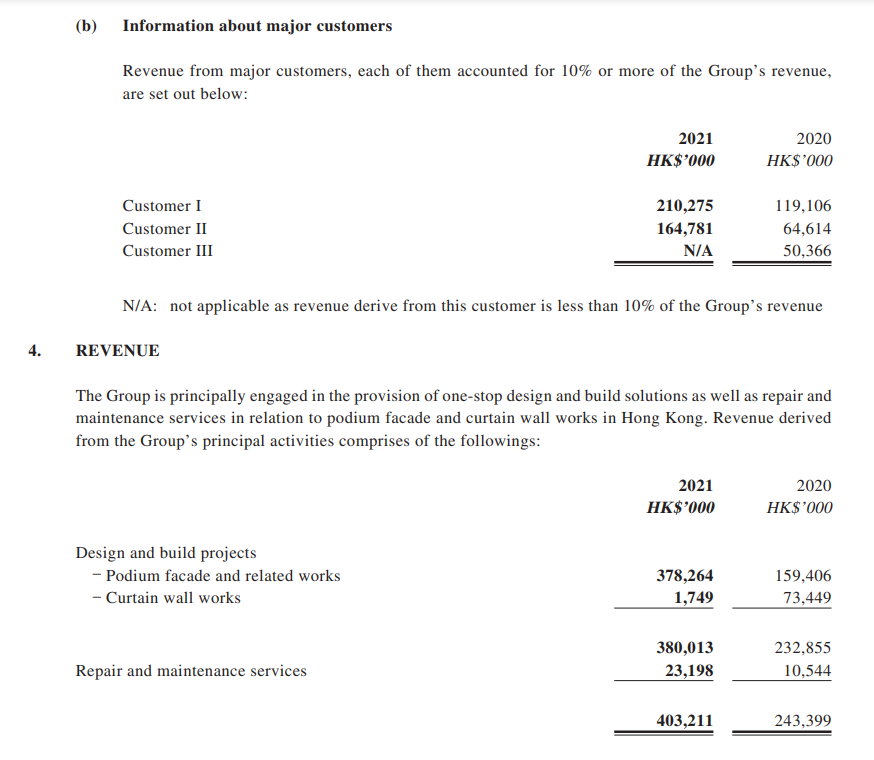
The biggest risk with G & M is customer concentration. Typically, G & M has had a high portion of its revenue come from one or two main customers, including Sun Hung Kai Properties, one of Hong Kong’s largest property developers. In 2021, 93% of revenue came from two customers.
This is obviously not good news. However, Hong Kong’s property development sector is highly concentrated. Million Hope, a larger curtain wall business listed in HK, also has a high level of customer concentration, with 94% of revenue in FY21 coming from its top five customers.
Historically, G & M’s most important customer has been Sun Hung Kai properties. G & M and SHK have a relationship spanning nearly 20 years, which brings some comfort. SHK has a strong balance sheet, with a 17.5% gearing ratio and interest coverage of 13 times as of December 31, 2021.
I am concerned about the customer concentration, but with G & M selling below liquidation value, we have significant downside protection. Additionally, we can manage the risk further with position size.
A note on G & M's cash
G & M has roughly $77m of net cash on its balance sheet, more than 50% of its current market cap. However, much of this cash is needed for operations. One of the reasons G & M listed was to raise cash to increase its ability to take on contacts. The prospectus notes:
“Based on the experience of the directors, according to the nature and specification of each project, the Group may generally incur maximum net cash outflows of approximately 23-28% of the contract sum at the early stage of its projects, particularly where the Group acts as a nominated subcontractor for the projects, and the customers generally make the first progress payment to the Group not until approximately five to seven months after the commencement of the relevant projects. Furthermore, the Group’s customers generally withhold usually 10% of each interim payment up to an aggregate of usually 5% of the total contact sum as retention money, which will only be fully released to the Group subsequent to the expiry of the defect liability period.”
While the cash offers some downside protection, I think it’s prudent to assume $0 excess cash (for enterprise value calculations, etc). On this basis, G & M still seems extremely cheap on both an earnings and asset basis.
Trailing EV/EBIT: 3.6
Trailing P/E: 4.4
Price to NTA: 0.62
Price to NCAV: 0.67
Outlook
G & M has contracts worth 1.4 years of revenue at FY21 rates. It is also bidding on additional contacts worth ~$350m. There is a significant pipeline of construction work in Hong Kong, with government spending on infrastructure projects expected to reach $100b annually in the next few years.
However, there are number of headwinds in the near-term, including COVID, labour issues and rising costs of materials.
The Group also experienced increasing staff drain owing to various social and labour market factors, reduction in work scope of already awarded projects attributable to economic uncertainties, and rising material prices as a result of disruption in supply chain, all of which will have lasting impact on the Group’s operations …
Faced with the uncertainties brought on by the prolonged COVID-19 outbreak, the Group will continue to adopt a more prudent approach in its bid for projects, focusing on those involving higher level of design element, technical capability and customized features with an aim to conserve its resources on quality projects by reputable customers with healthy profit margins.
While these issues are concerning, and will likely impact margins, G & M remained profitable through the initial COVID outbreak and has some protection from its forward order book. If we assume earnings fall back to 30m, G & M would still trade on ~5.3 PE, and could maintain the current dividend.
Catalysts
I don’t have a particular catalyst in mind. G & M seems extremely cheap whichever way you look at it. It would benefit from a recovery of the broader HK market (which has been depressed). If the stock continues to languish, the majority shareholder could also take it private, which could likely be funded through the dividends paid to date.
If you buy today, you're entitled to a 1.1 cent dividend on July 8, worth roughly ~6.8% of your purchase price. (The ex-dividend date is June 13.)
If you have any thoughts on G & M, or if you spot a problem with my thesis, I'd be very interested to hear from you.
No comments:
Post a Comment